Features
Connect once. See unified revenue net of fees. Get one recommended next action.
Data Sync connects your platforms in minutes. ORACLE rolls your income into one net-of-fees number. TaxWise calculates your monthly set-aside automatically. ARIA reads your real data and gives you one next action — your approval before anything moves. Start free; Pro $99/mo adds TaxWise and ARIA agents.
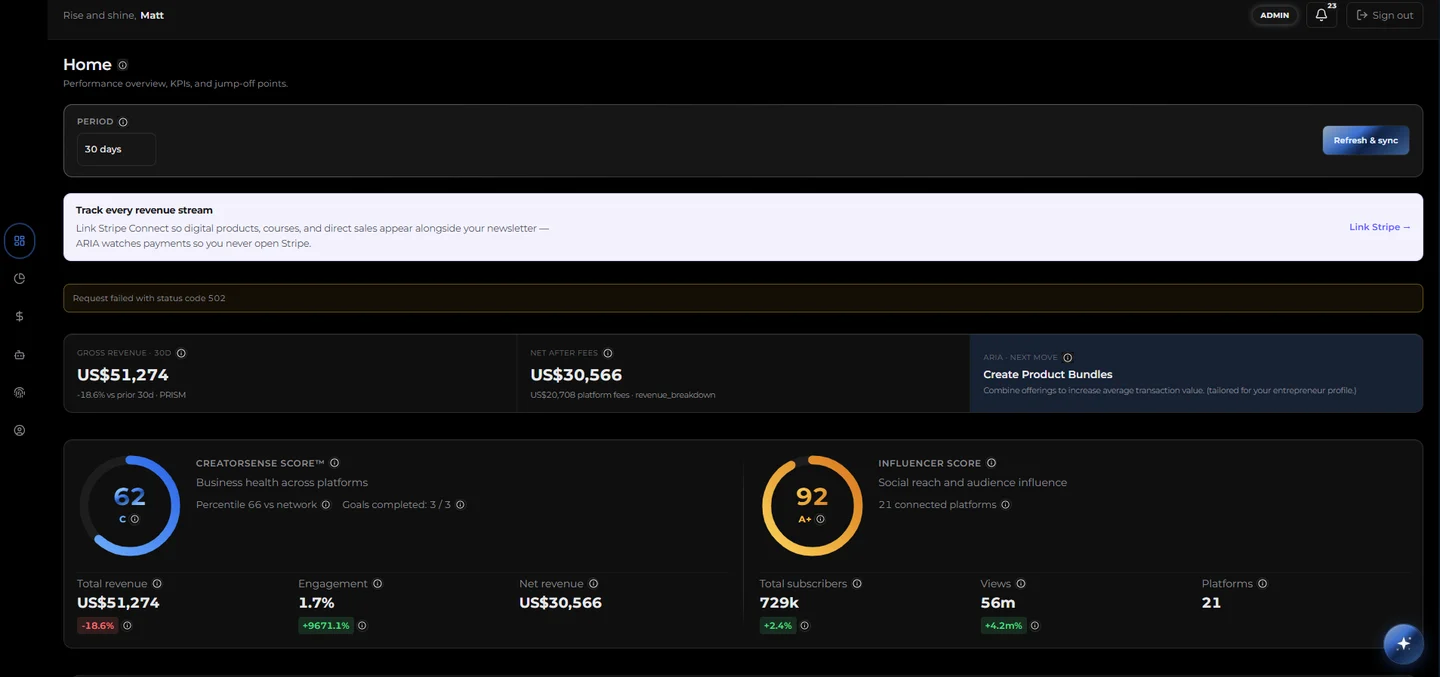
Unified HQ Dashboard
Connect your platforms and see everything in one place. Revenue, subscribers, engagement, all synced, all in real time. No spreadsheets. No switching tabs.
- Supports YouTube, TikTok, Instagram, Patreon, Substack, Teachable, Stripe, and more
- No public API for a platform? Install CreatorSense Data Sync from the Chrome Web Store (local sync while you’re logged in)
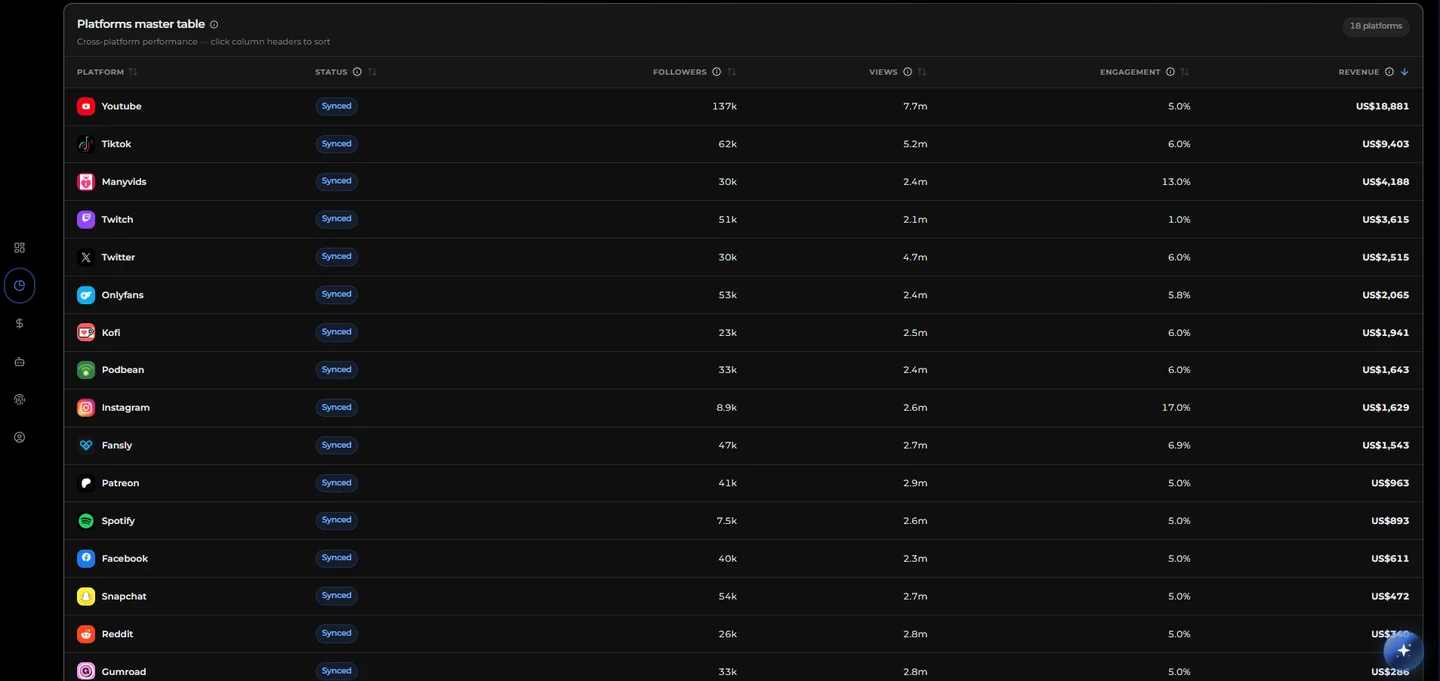
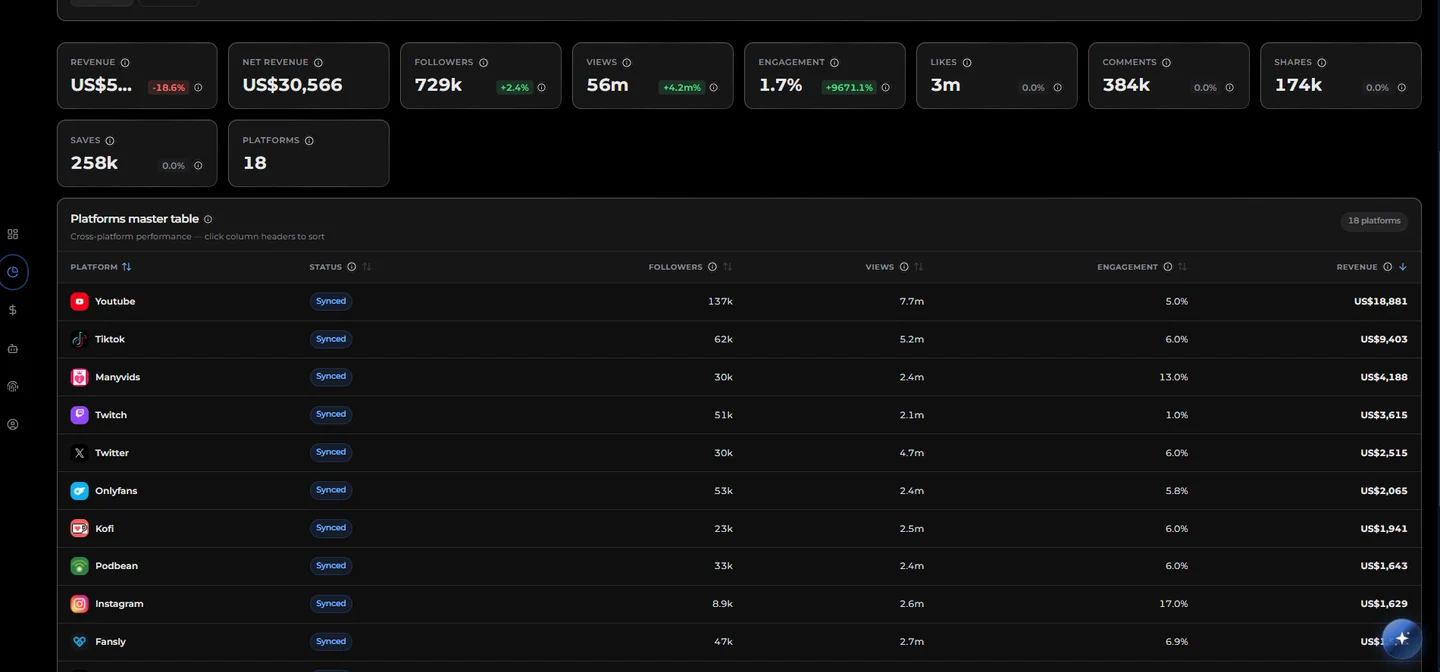
- Revenue and subscriber trends at a glance
- Platform-level and content-level drill-down
- Free: 2 platforms · Starter: 8 (5 accounts each) · Pro: 30 (5 accounts each)
ARIA: Your AI Advisor
ARIA isn't a generic chatbot. Every response is grounded in your connected platform data. Ask about last month's top performer, why a revenue spike happened, or what you should make next.
- 8,000 ARIA messages/mo on Pro · 2,000 on Starter · 50 on Free
- Agency: ARIA Agent for in-app workflows — e-contract help on Scale+
- Answers grounded in your real data, not generic advice
- ARIA Outcomes tracks which suggestions you acted on and what happened
- Pro: deepest Platform Intelligence and monetization health
Revenue forecasts
Uses your connected platform history to generate 30, 60, and 90-day revenue forecasts as probability ranges, not single-number guesses. It also flags unusual changes and tells you what to watch.
- 30 / 60 / 90-day revenue forecast ranges
- Anomaly detection, flags unexpected drops or spikes
- Forecast accuracy improves with more data history (3+ months is ideal)
- Starter: 12-month lookback · Pro: 24-month lookback
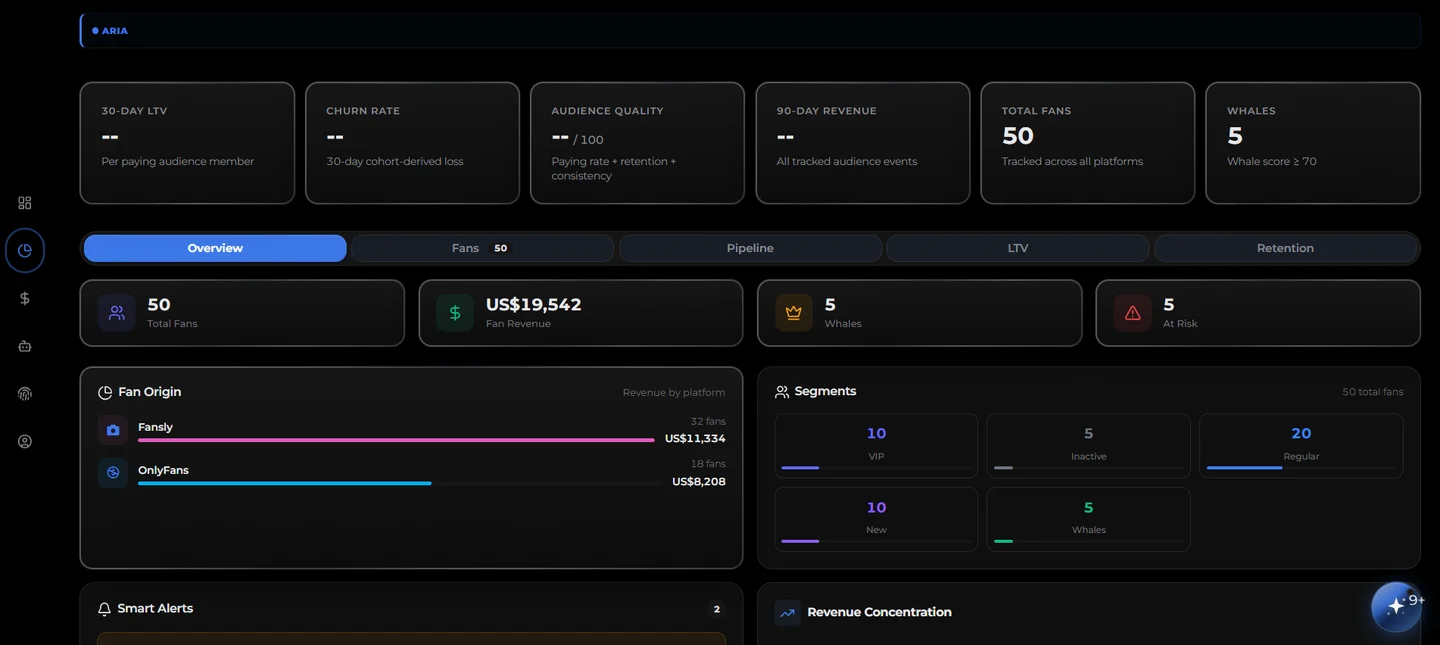
Audience Intel & Asset Library
Audience Intel on Starter includes a Fans directory up to 25k records. Pro raises fan CRM limits, Sponsorships pipeline, and expanded cloud storage for creative assets—see Pricing.
- Fans directory & CRM: segments, LTV, and high-value fans
- Sponsorships pipeline for brand deals (Pro)
- Asset Library: 15 GB (Starter) · 40 GB (Pro)
- Performance and revenue tie back to HQ and Platform Intelligence
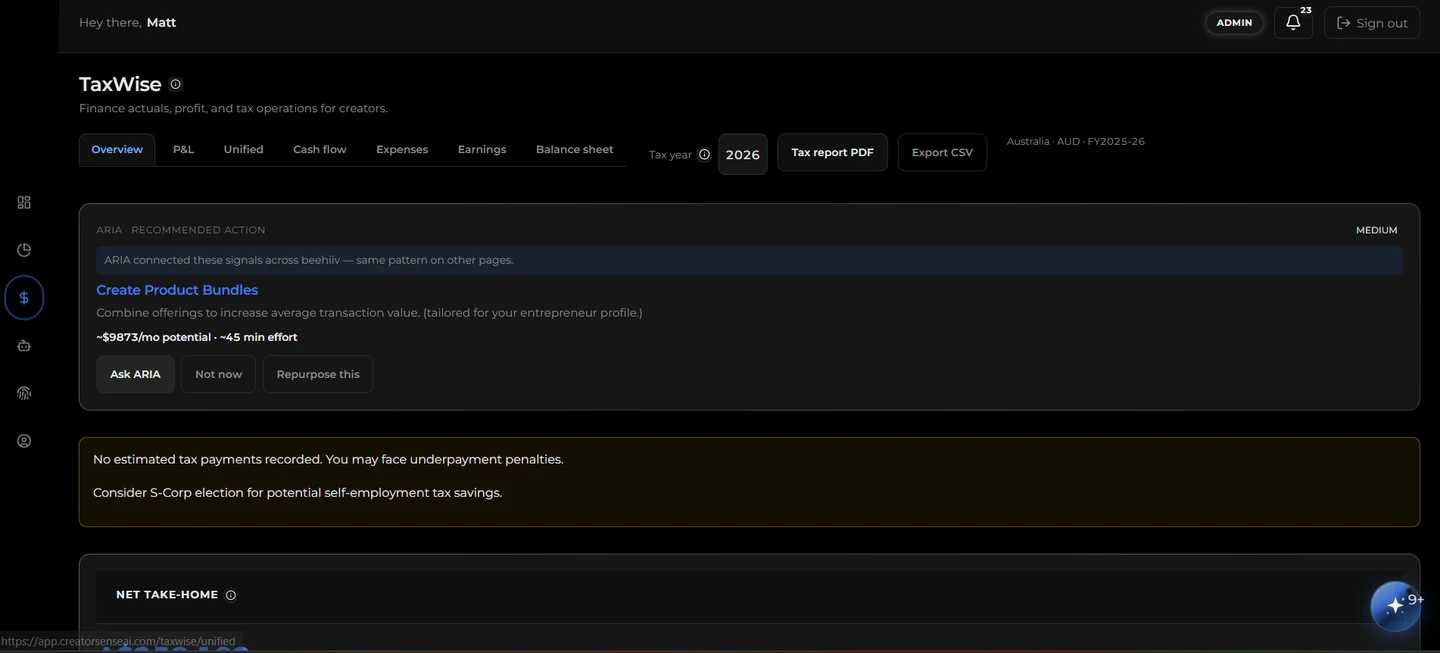
TaxWise: Tax Estimation
TaxWise provides quarterly tax estimates on Pro and Pro so you know how much to set aside—no surprises at year end. Covers 9 countries. Not a filing service; not legal or tax advice. Always use a qualified professional for filing.
- Quarterly tax estimates across US, UK, CA, AU, DE, FR, JP, NL, BR
- Expense tracking and earnings management
- Revenue imported directly from your connected platforms
- Estimation only, consult a tax professional for filing and legal advice
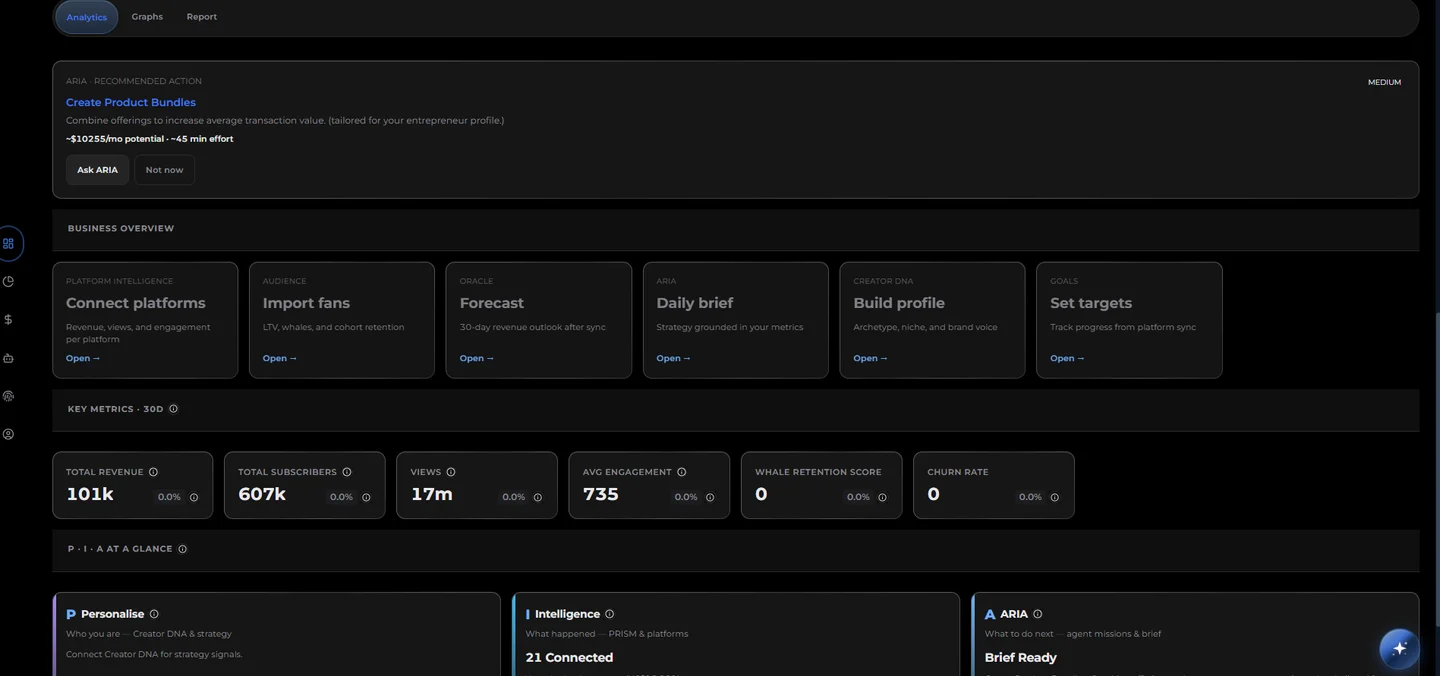
Personalization · Intelligence · ARIA
The product spine: Personalization captures your profile and goals; Intelligence aggregates connected platform data into unified metrics; ARIA turns both into briefs and next moves — with approval gates before anything writes.
- Cross-platform revenue, engagement, and subscriber signals in one dashboard
- Revenue forecasts and alerts grounded in your history — not generic benchmarks
- Your profile tunes recommendations and ARIA context to how you actually work
- Audience economics — retention, LTV, and fan segments where your plan includes them
Agency desk
Managers get roster-wide intelligence, team invites, and ARIA briefs grounded in live connected data—not a solo dashboard pasted onto a spreadsheet.
- Roster health, revenue, and drift in one desk
- Same Prism data model creators use—no shadow spreadsheets
- On-chain e-contracts — signed agreements with permanent verify links (Scale+)
Start free. Upgrade when you need more.
Every feature above comes from the app. Nothing is fabricated or planned, it's live and waiting for you.