Unified
Dashboard
Stop juggling a dozen different apps. Your entire creator business — analytics, forecasts, and professional reports — all in one place, across three simple tabs.
Everything in its place.
Three views. Every module. Full control.
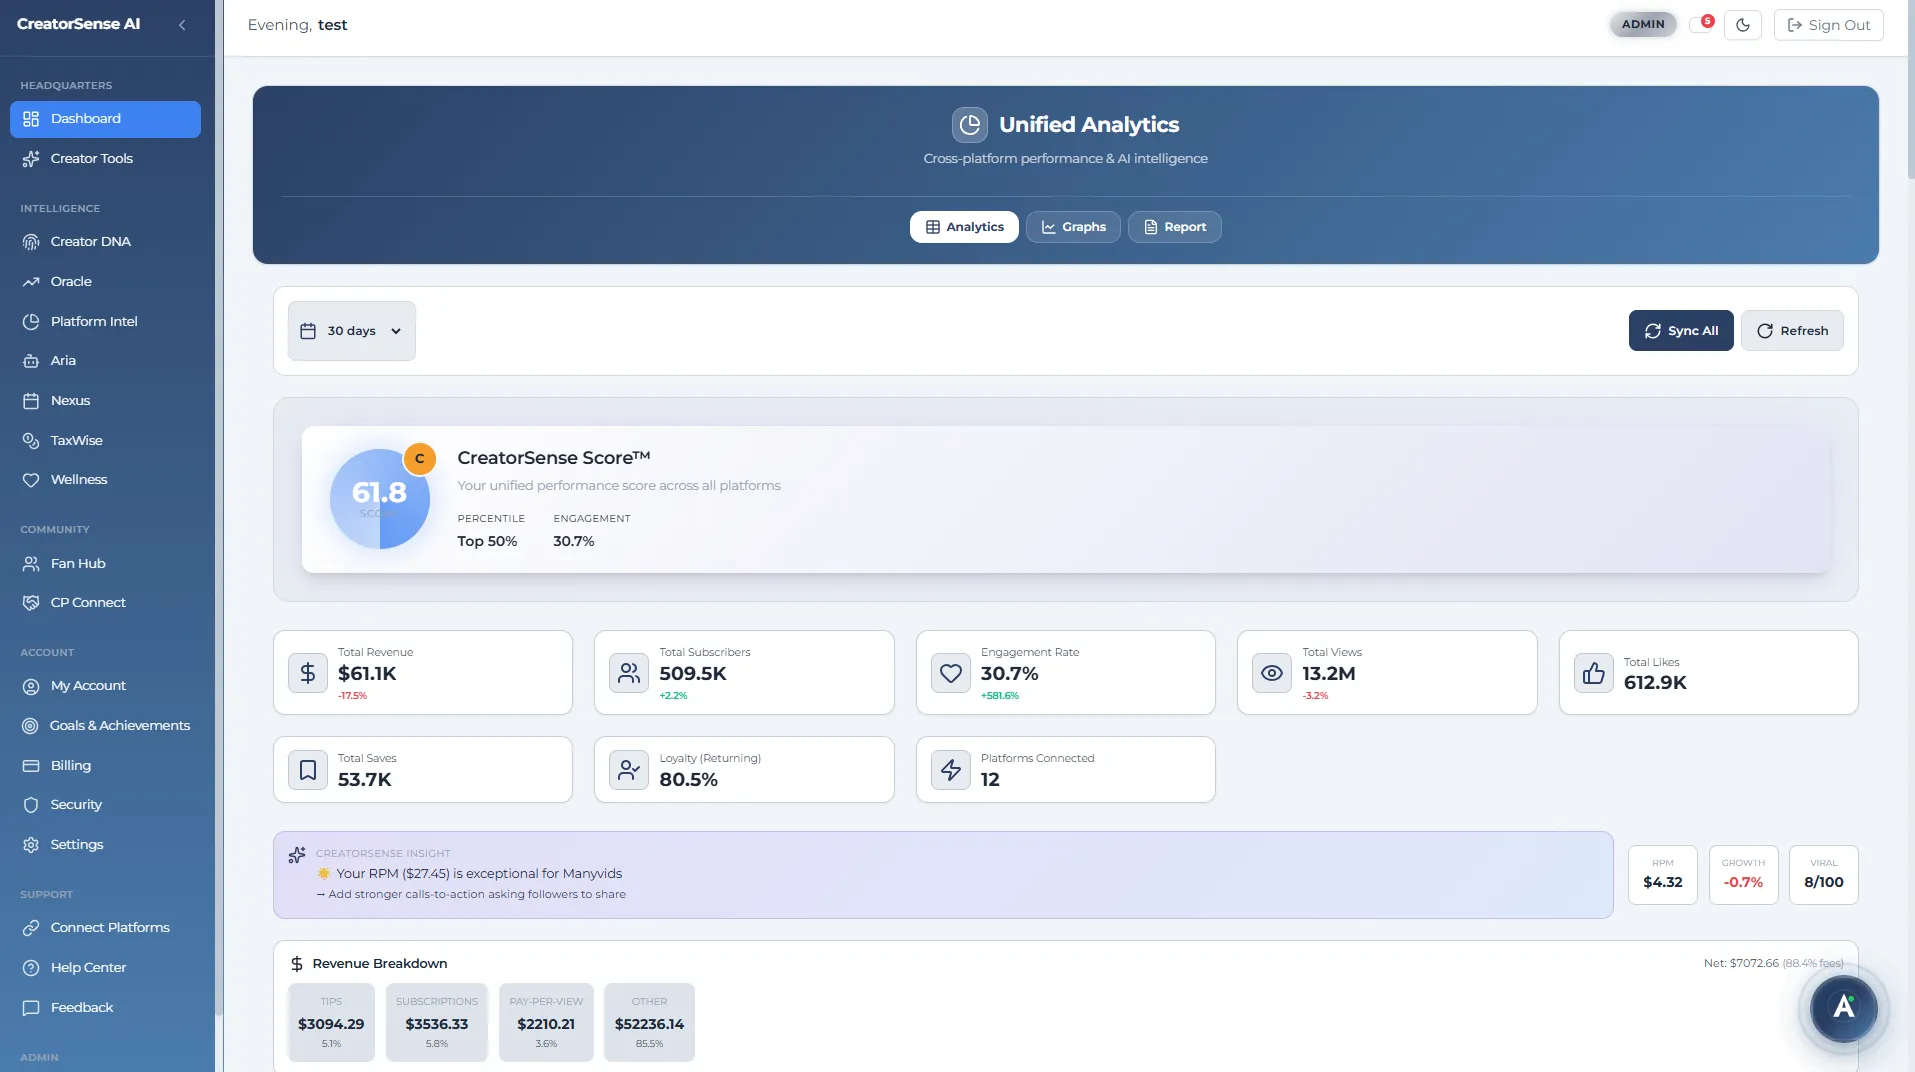
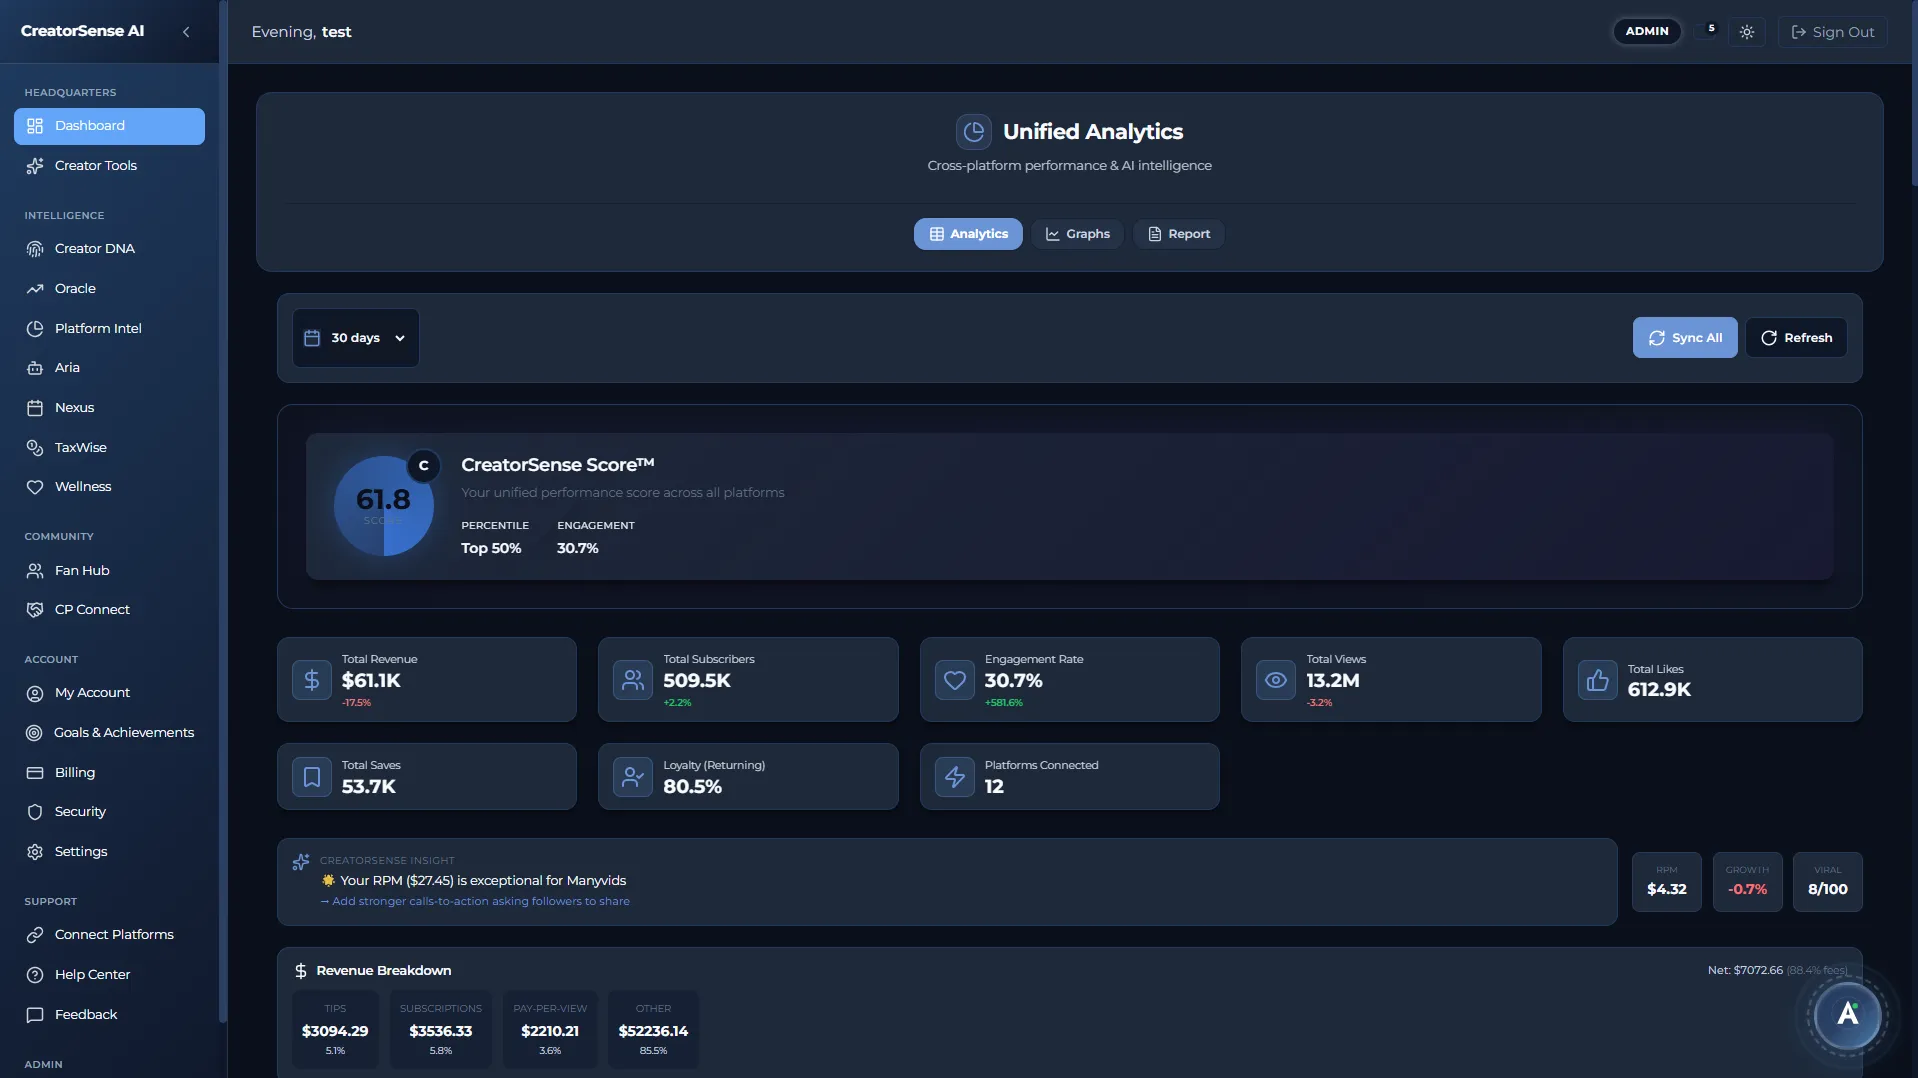
Analytics Tab
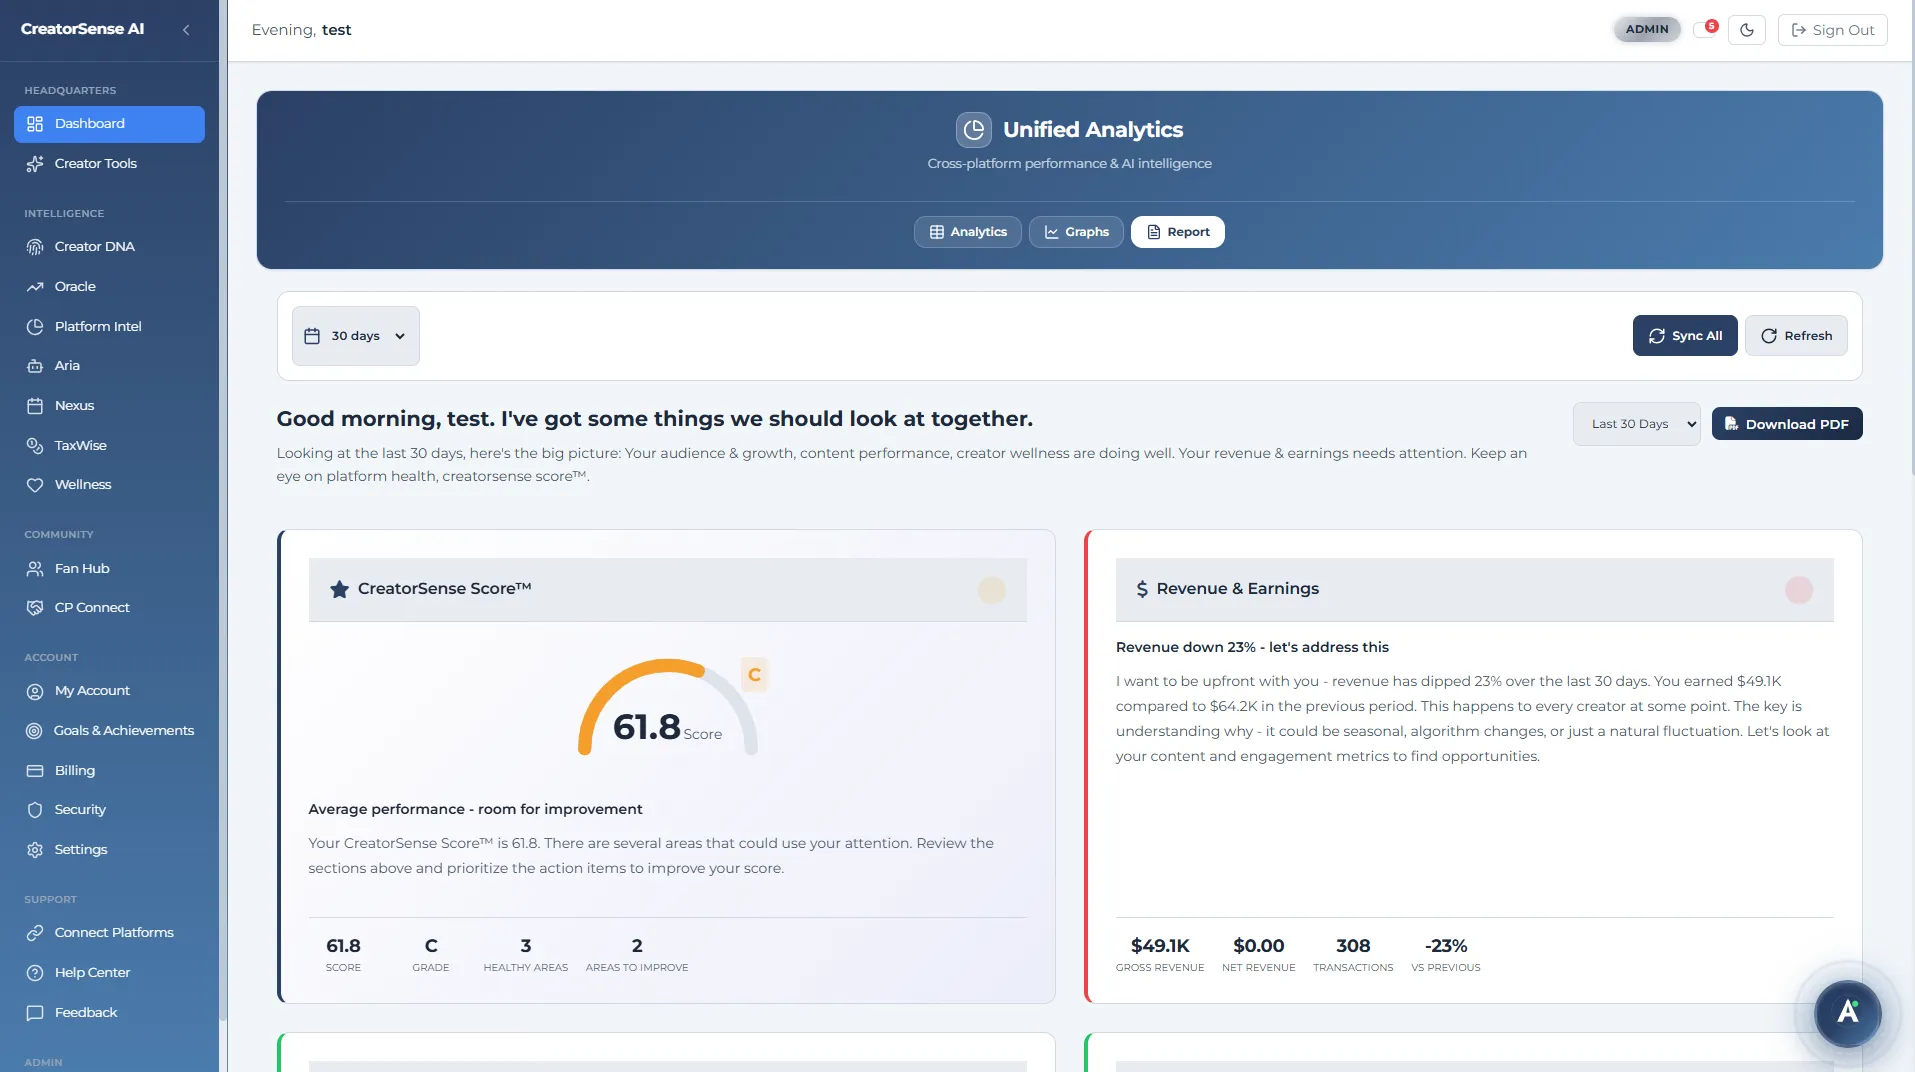
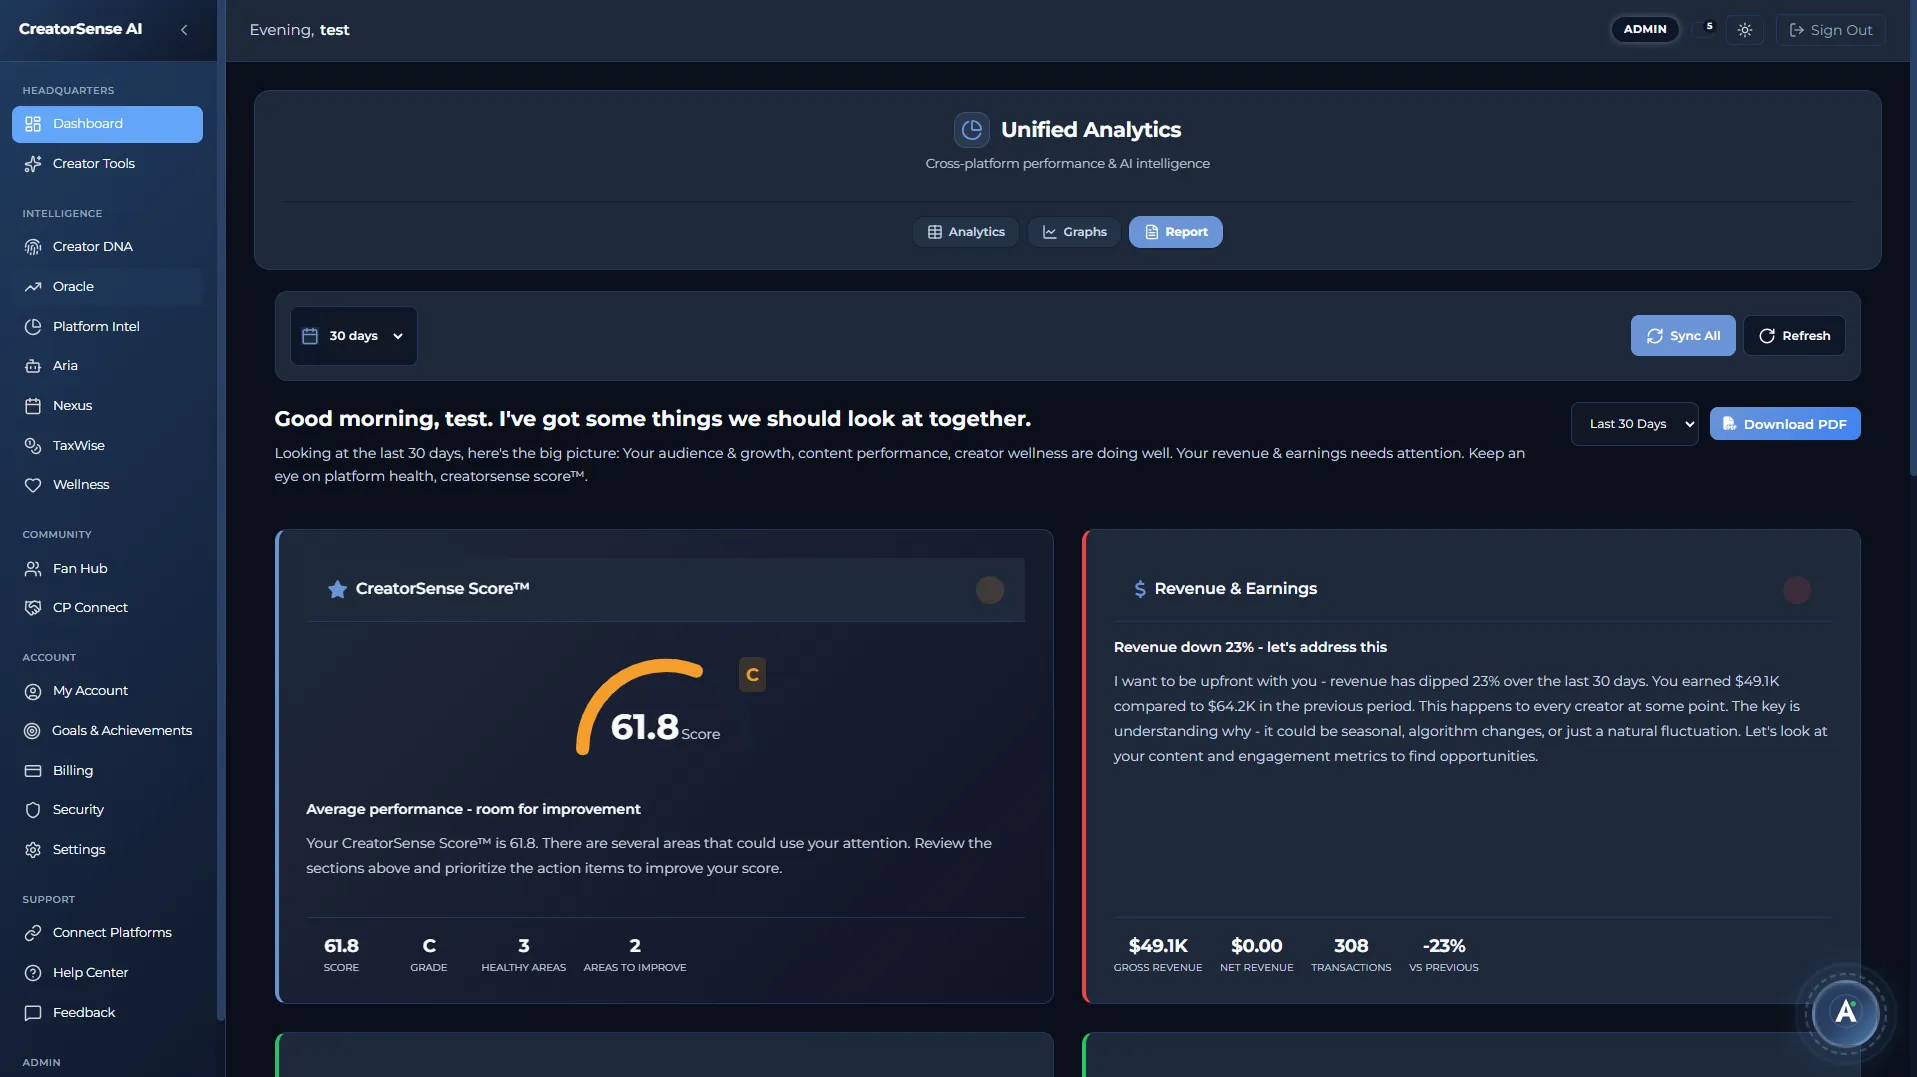
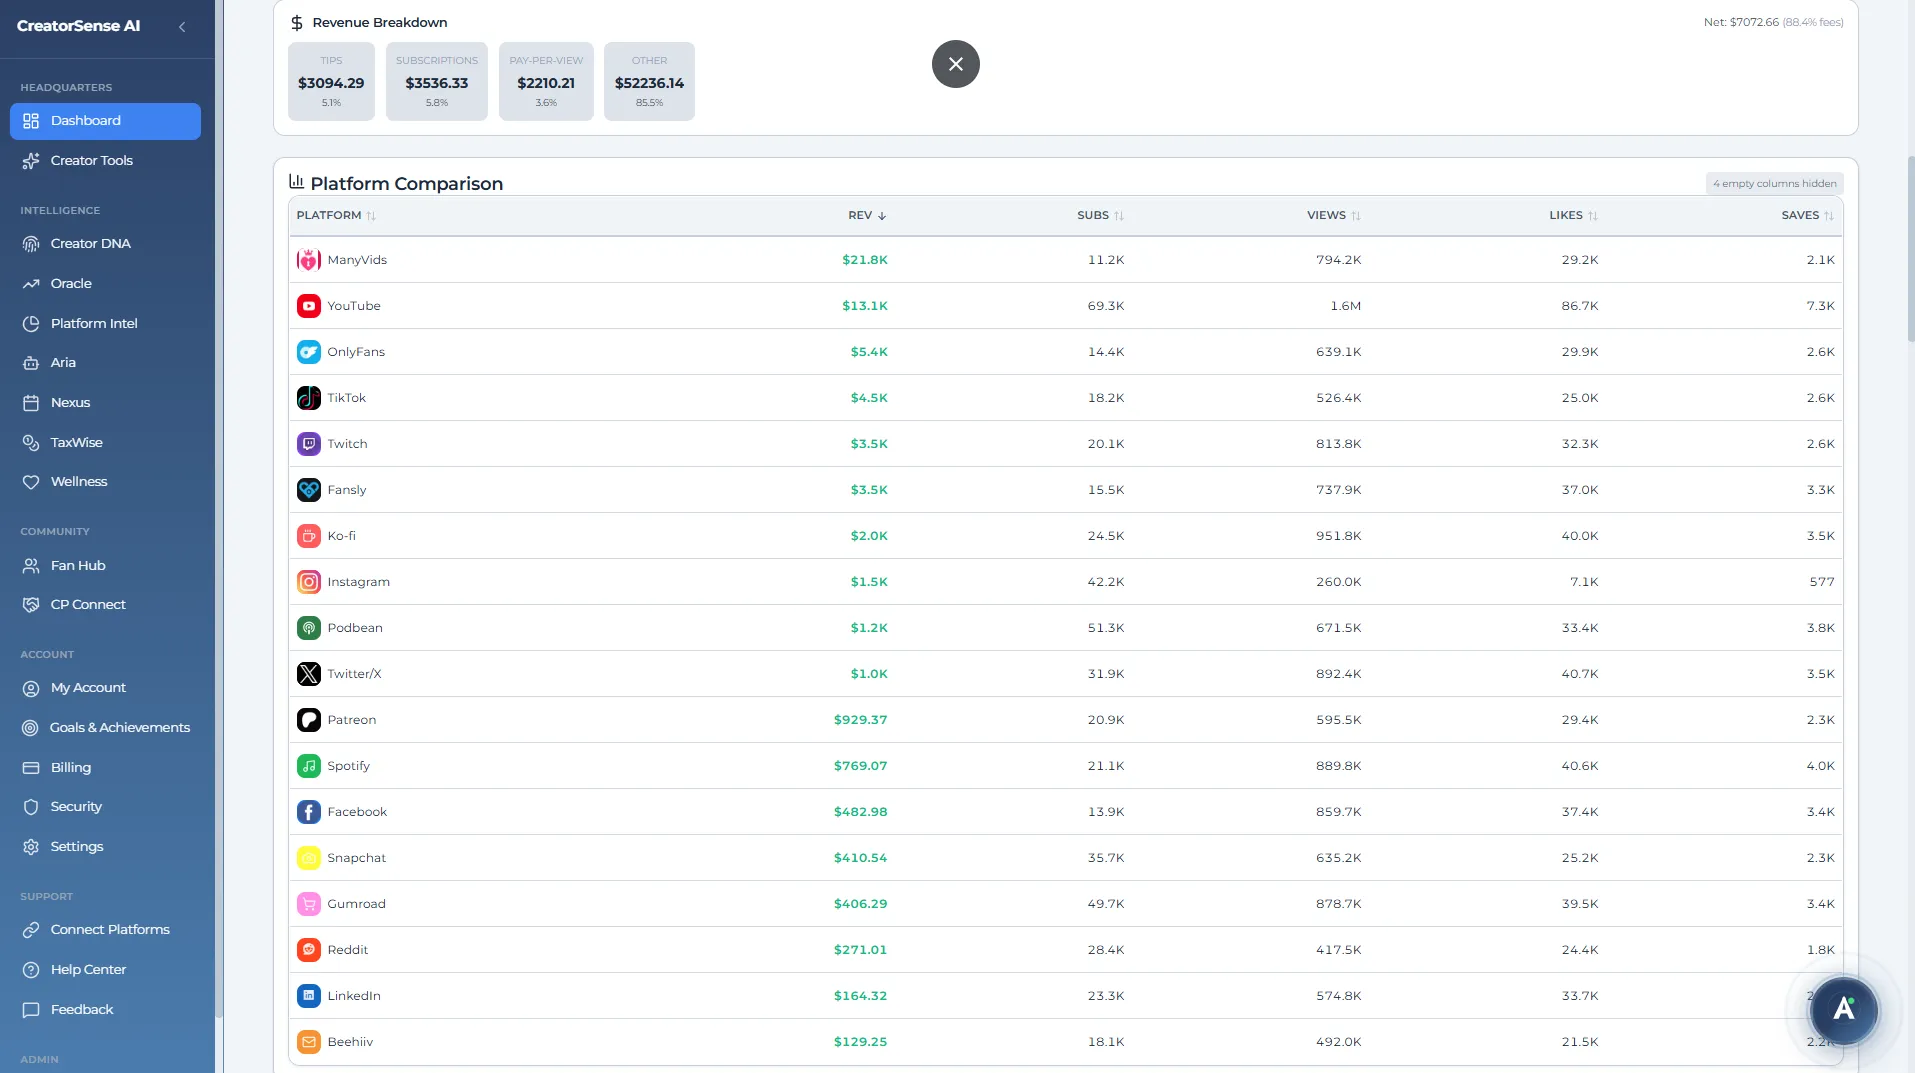
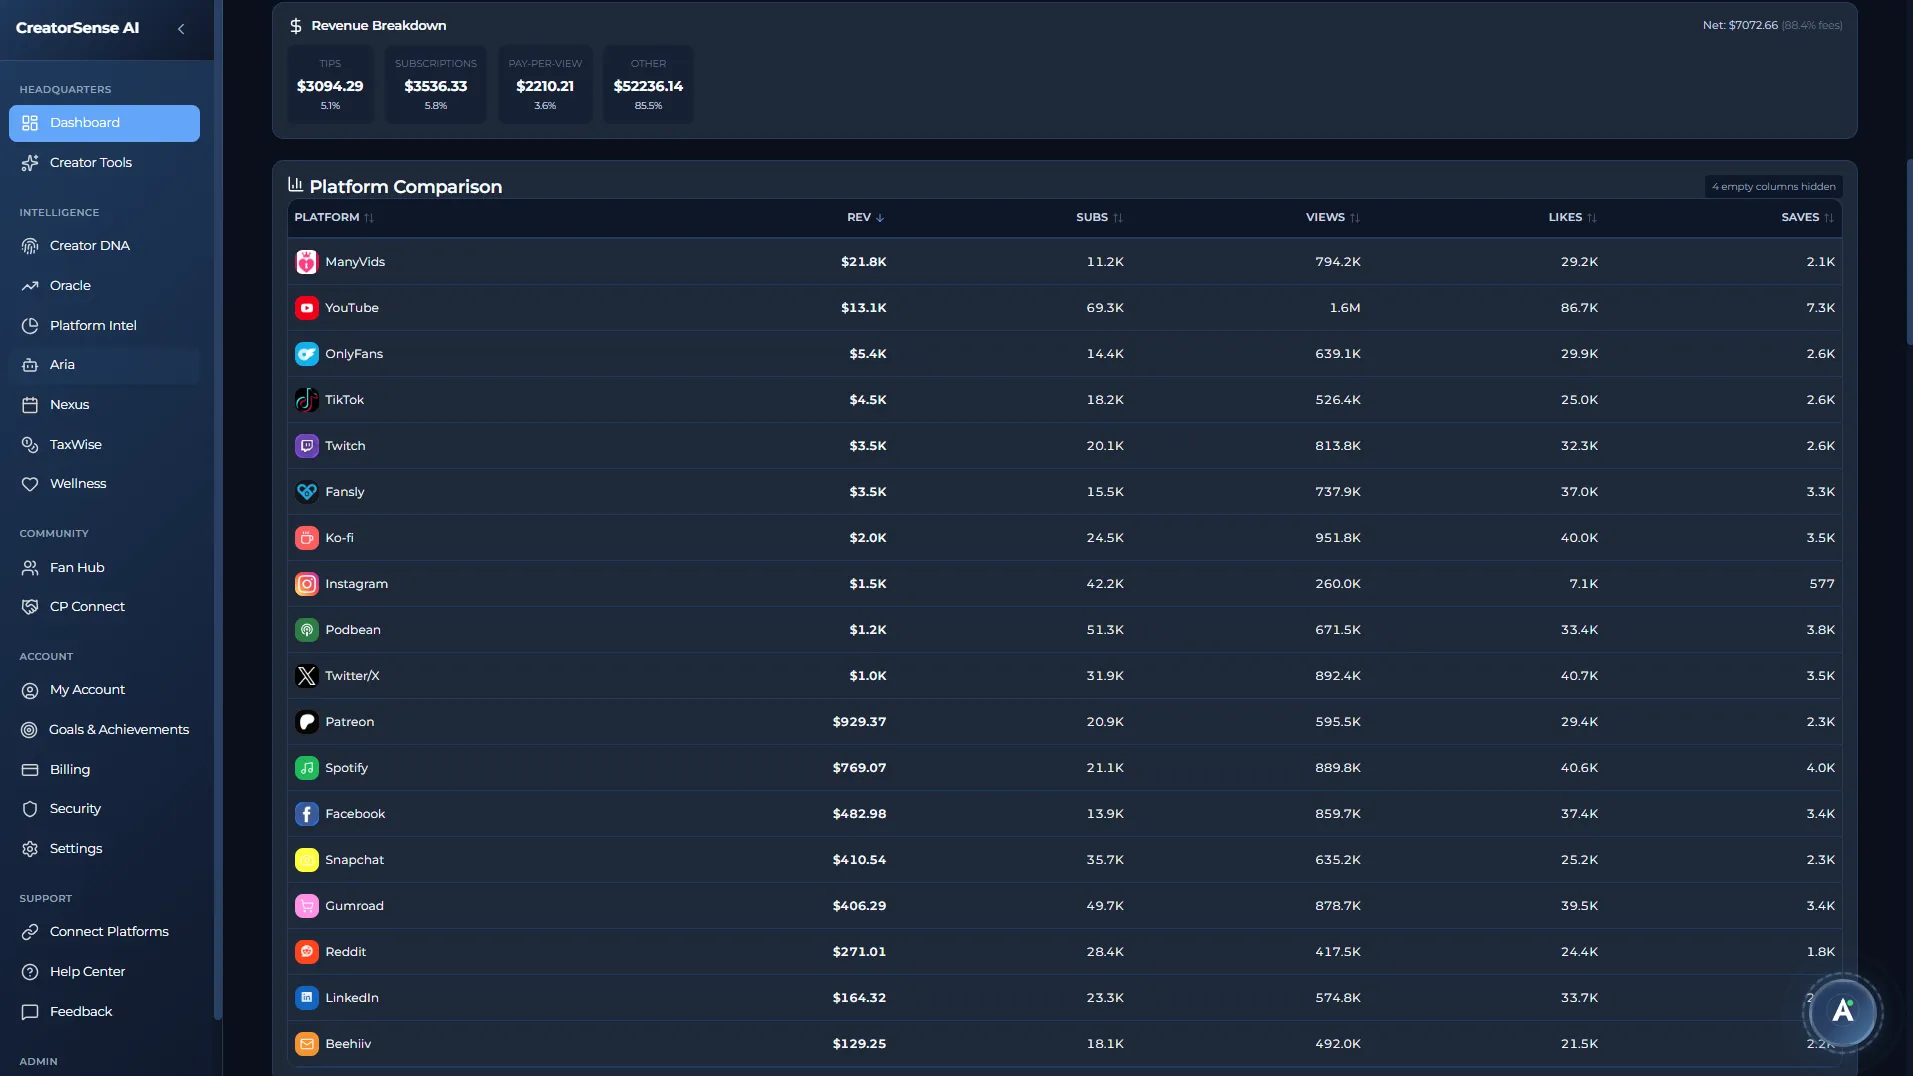
Command CentreYour CreatorSense Score™ hero sits at the top — grade, percentile rank, engagement rate, and goals progress at a glance. Below it, a nine-card bento grid gives you live summaries of every module: Oracle revenue insights, Platform Intelligence, Audience health, TaxWise financials, Goals, Collaborations, Wellness, Security, and Creator DNA — each card links directly to its full page. Collapsible sections underneath surface Revenue Breakdown, Subscriber Tiers, Top Content, Active Goals, and your schedule for today.
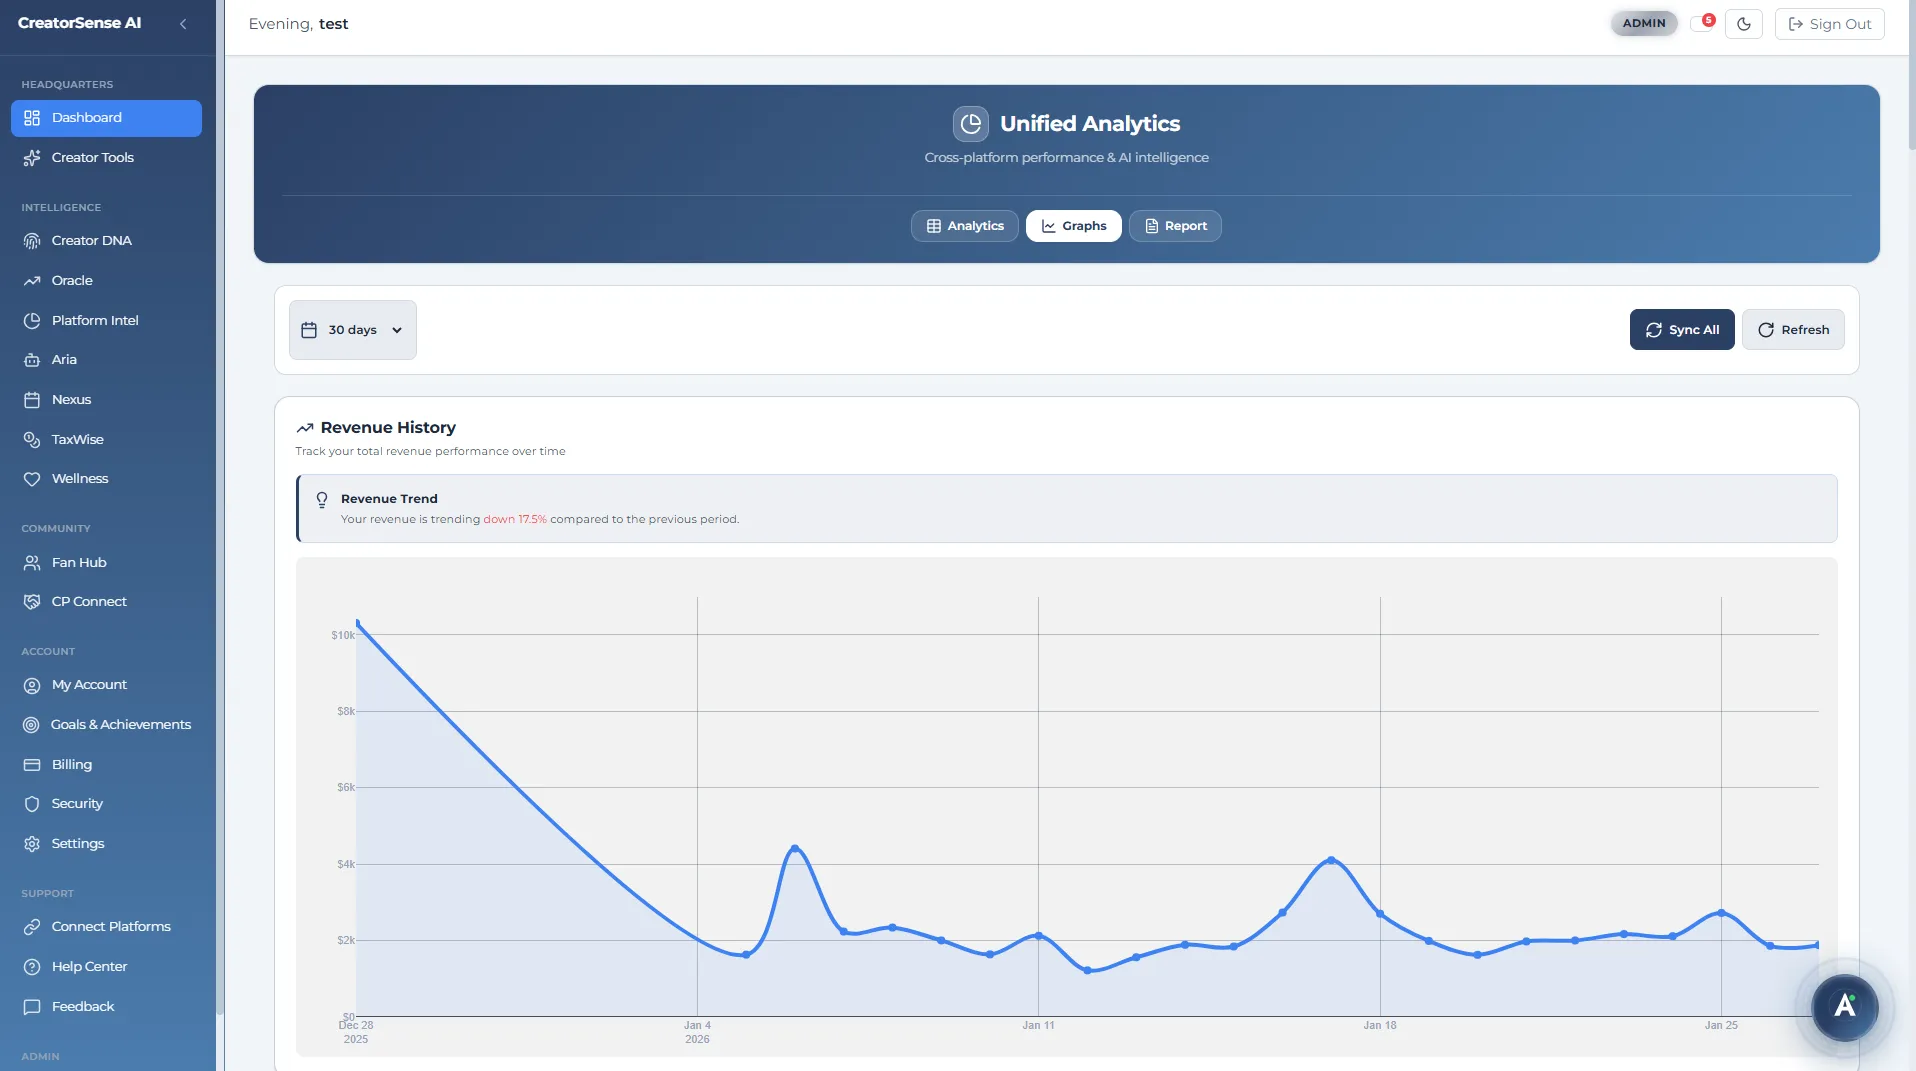
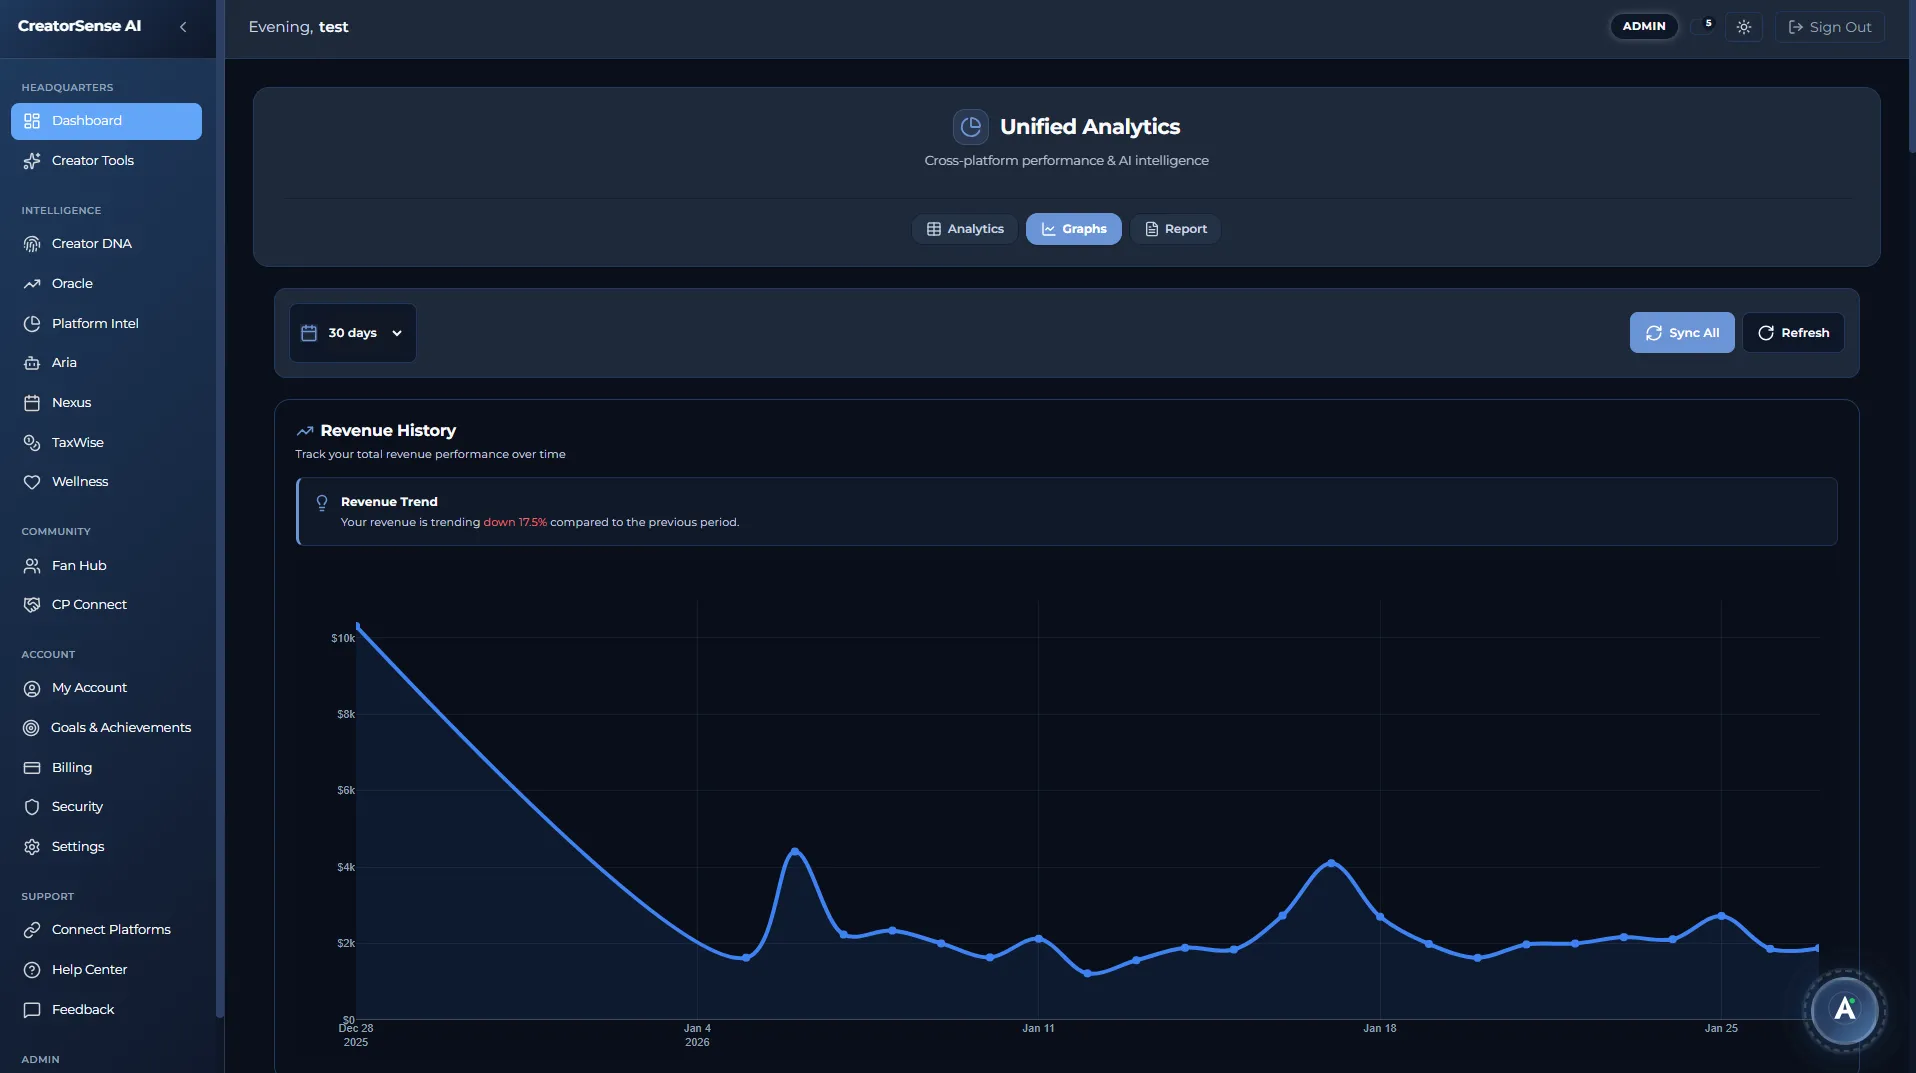
Graphs Tab
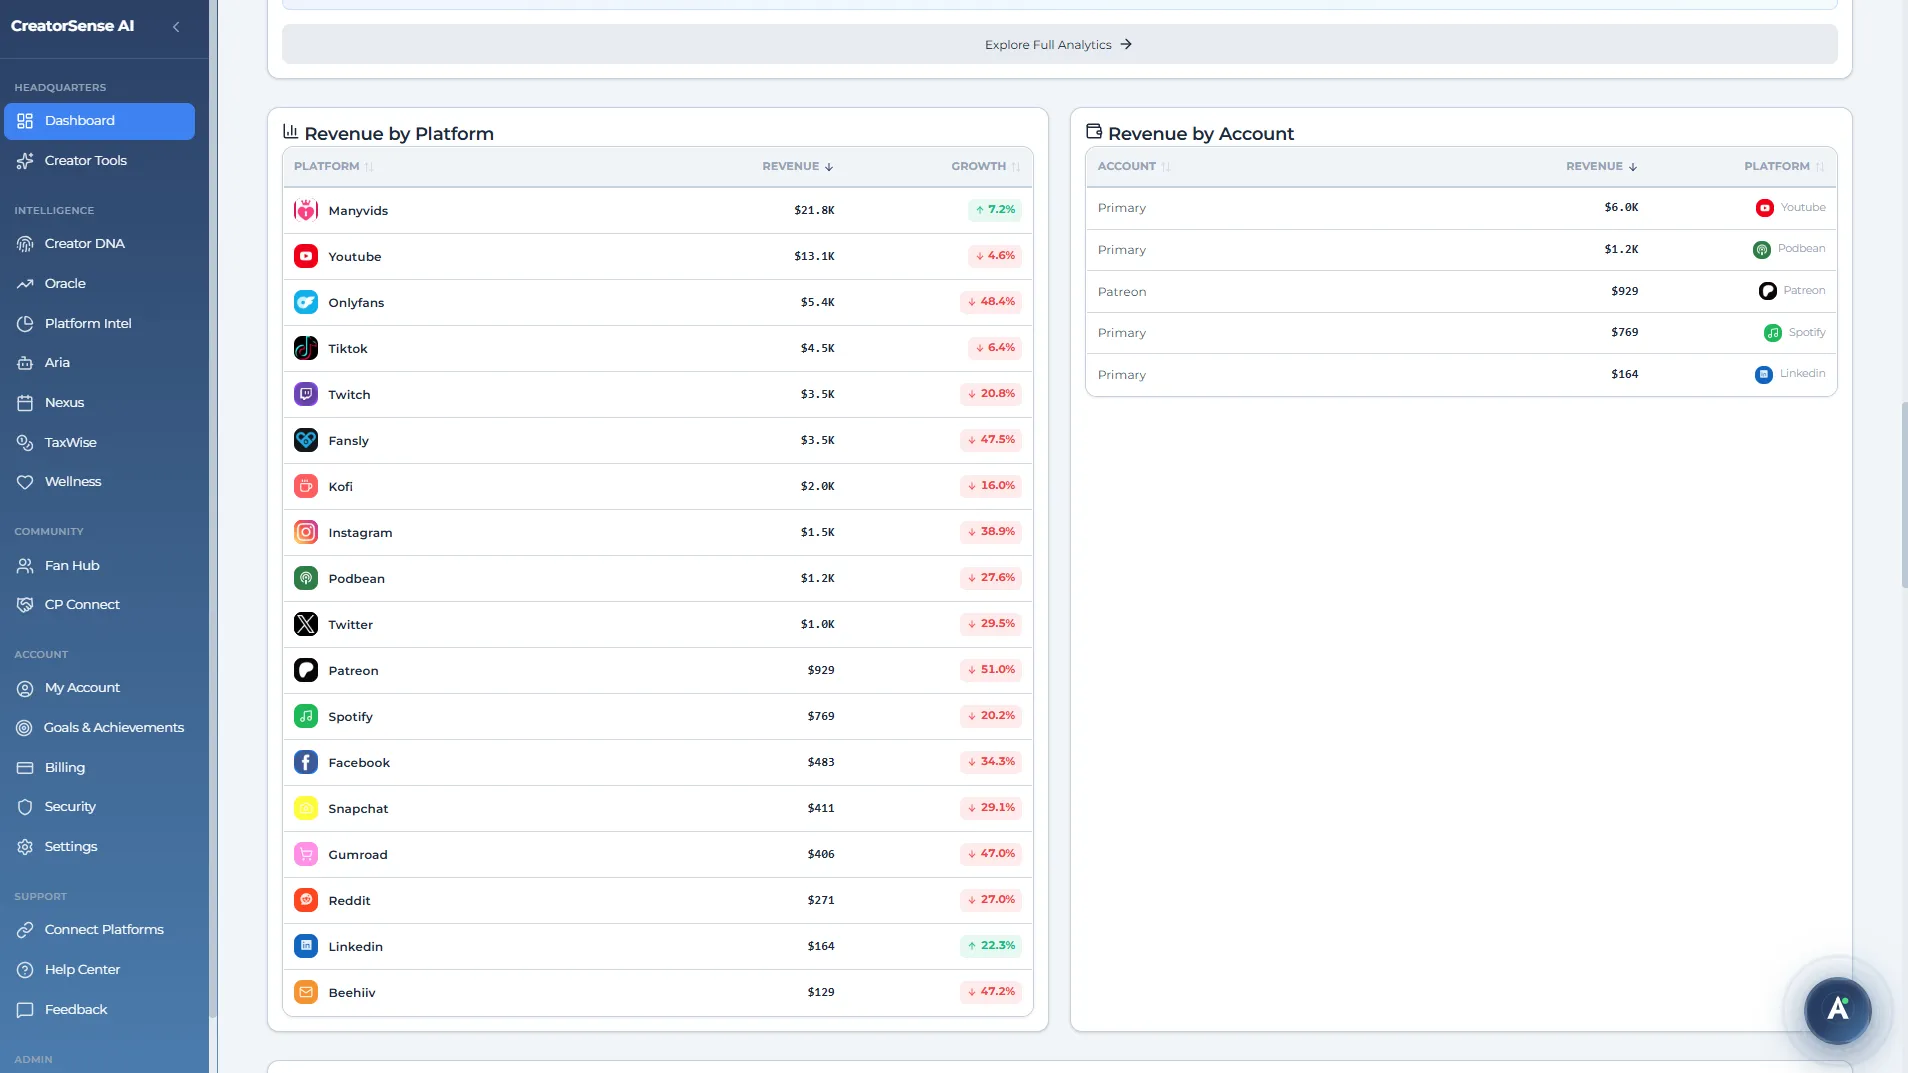
Visual TrendsInteractive Plotly charts showing Revenue History over time, Revenue by Platform, Engagement vs Revenue scatter (to find your best ROI platform), and Cross-Platform Correlation analysis — including lagged patterns showing how posting on one platform drives growth on another. An Oracle Forecast teaser links directly to your full 30–365 day revenue and subscriber projections.
Report Tab
ARIA-Powered PDFOne click and ARIA writes a professional business report: your performance summary, platform health grades, risk flags, and a 30-day outlook. Ready to share with banks, agencies, or your accountant. A freshness indicator always shows how up-to-date your data is.
Everything in one place — finally.
The Unified Dashboard replaces a dozen separate platform dashboards with a single command centre. The nine bento cards on the Analytics tab give you a real-time pulse across every module — click any card to go straight to the full detail page. Switch to Graphs for trend analysis and correlation insights, or open Report to generate an AI-written business summary in one click.
The CreatorSense Score™
One number that captures your entire business health. A–F grade. Percentile rank. Five components.
Engagement Rate
Cross-Platform AverageWeighted engagement across every connected platform — not just your best performer. Includes likes, comments, shares, saves, and platform-specific interaction signals.
Growth Velocity
Follower MomentumAverage follower and subscriber growth momentum across all platforms. Accelerating growth adds to the score; plateaus or declines reduce it.
Revenue Consistency
Income StabilityHow predictable and diversified your income is. A creator earning steadily across three platforms scores higher than one with a single volatile revenue stream.
Content Quality Signals
AI-AssessedAI analysis of your top-performing content patterns — save rate, share rate, completion rate, and comment-to-like ratio — to score the quality of your creative output.
Goals Achievement
Milestone ProgressYour goals success rate feeds directly into the score — the ratio of goals achieved to goals set. Connect it to your Goals & Achievements page to unlock this pillar and boost your grade.
Platform Intelligence — every metric that matters for brand deals.
Beyond the unified view, the Platform Intelligence module gives you per-platform breakdowns of the metrics brands and advertisers actually care about:
- Brand Rate — recommended sponsorship price range (low–high) per platform
- Audience Value — estimated commercial value per 100 followers
- Total Brand Value — sum of max sponsorship rates across all platforms
- Best Posting Window — the best day and hour to post on each platform, with how much better it performs vs. other times
- Platform health status: Thriving · Healthy · Needs Attention · Declining · Critical
Up and running in minutes.
Connect your platforms
Sign in to YouTube, Instagram, TikTok, OnlyFans, Fansly and 25+ more. Your login details are never stored — only a temporary access key that can be revoked at any time.
Data pulls in automatically
Your analytics, earnings, and audience data start loading in the background immediately. The first sync completes within minutes.
Review your CreatorSense Score™
Open the Analytics tab — your Score hero shows your grade, percentile, and engagement rate. The bento grid below gives you a live snapshot of every module in your account.
Generate your first report
Switch to the Report tab and hit Generate. ARIA writes a professional business summary in under 30 seconds — ready to share with banks, agencies, or your accountant.
See your business whole for the first time.
Join the beta and connect your platforms today.