The metrics brands use to value you — finally visible to you.
When brand negotiations or content bets feel like guesswork, Platform Intelligence gives negotiating-grade numbers. See RPM, rate guidance, audience health, and timing signals per platform in one place.
Rate
Window
Know exactly what your audience is worth — and what brands should pay.
Three proprietary metrics that no standard analytics tool surfaces. Built from live platform data.
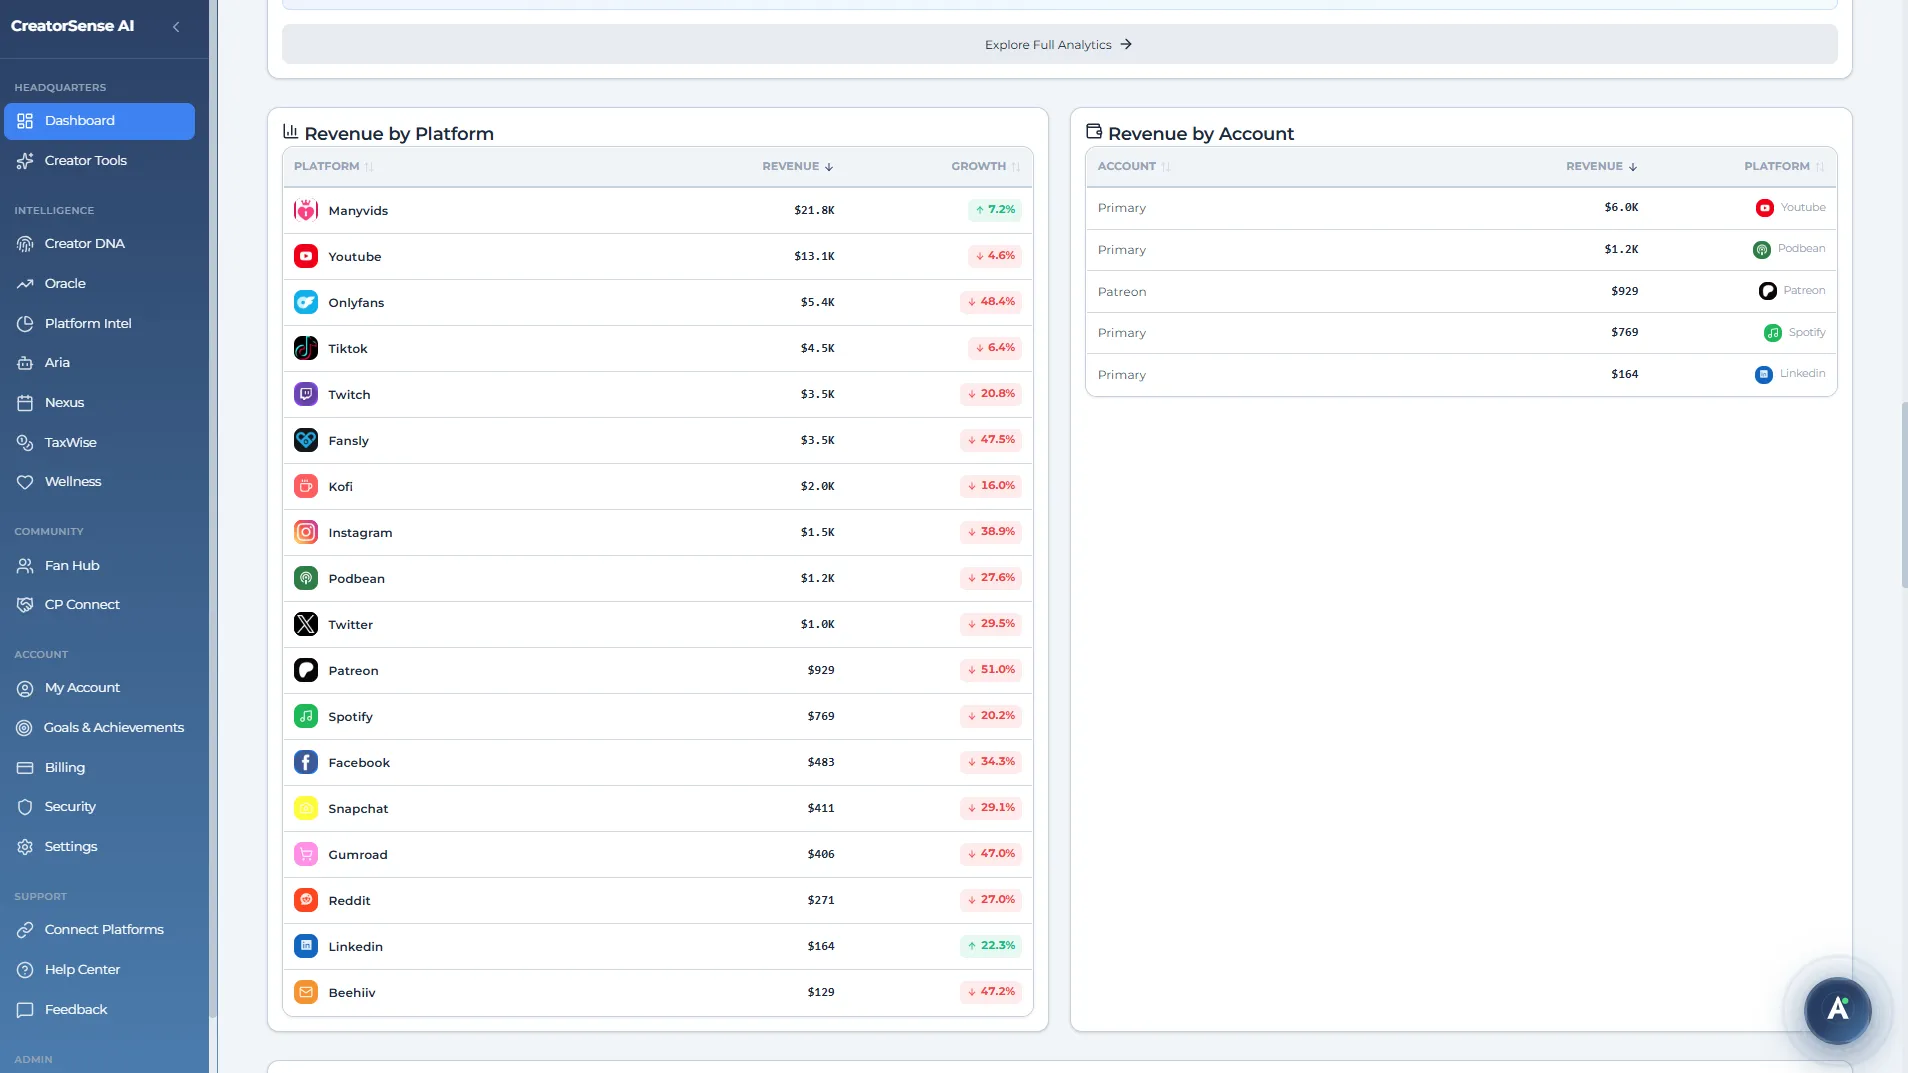
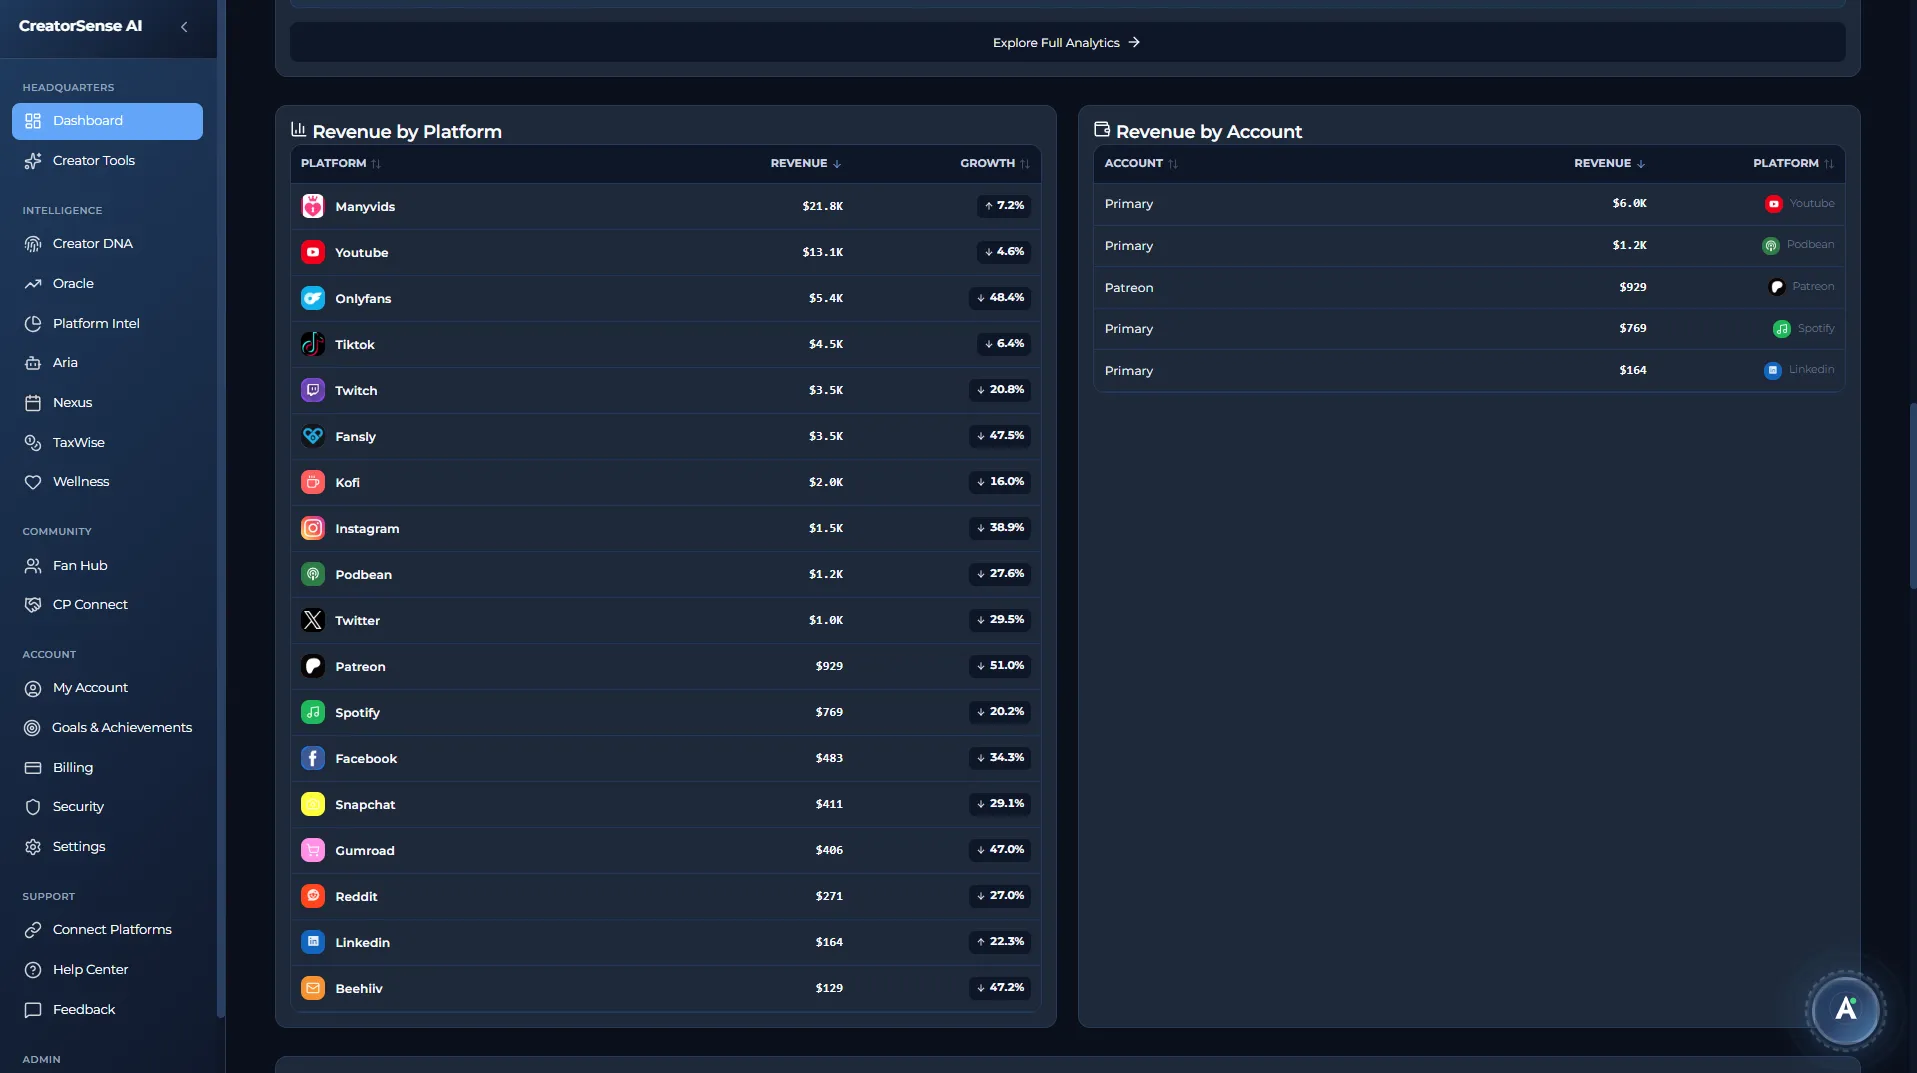
Master Data Table
New v2.5A spreadsheet-style table showing key metrics across connected platforms in one place. Use the in-app sort dropdown and filters to reorder what you see. You can download the current filtered table as CSV from Platform Intelligence. For a full account archive, use Settings → Data & Privacy (JSON export).
Brand Rate (Low–High)
Sponsorship Price RangeThe recommended price range for a sponsored post on this platform — calculated from your reach, how much your audience engages, and what advertisers typically pay in your niche. Stop guessing what to charge. Negotiate with actual numbers.
Audience Value
$ per 100 Followers · A–F GradeEstimated commercial value per 100 followers on this platform — graded A through F. High grade = brand-deal magnet. See exactly how your audience compares to industry winners.
Total Brand Value
Across All PlatformsThe sum of maximum sponsorship rate estimates across all connected platforms. Your single headline number for brand partnerships: "My combined platform reach is worth up to $X per campaign."
Audience Health, Viral Potential & Content Efficiency.
Three scores that tell you the quality of your audience — not just the size.
Audience Health (0–100%)
A composite score built from three components:
- Follower Quality — how many of your followers are real, active people (vs inactive or bot accounts)
- Engagement Quality — whether your likes, comments, and shares are genuine or artificially inflated
- Audience Growth — is your audience expanding, staying flat, or declining?
A creator with 50K followers and 85% Audience Health is more valuable to a brand than one with 500K followers and 30% health. Platform Intelligence tells you which side of that equation you're on — and what to fix.
Viral Potential (%)
An AI-estimated percentage chance that content from this platform spreads above your average — based on how quickly your posts gain traction, how often people share them, and how many people save them.
Avg Views/Post (Content Efficiency)
How efficiently your content distributes across this platform relative to your follower count — flagged as above or below your personal benchmark.
Best Day. Best Hour. Exact engagement multiplier.
Platform Intelligence calculates your personal Peak Performance Window — not a generic "post on Wednesday" guideline, but your specific best day and hour based on your actual historical engagement data, with a concrete multiplier showing exactly how much more engagement you get in that window vs. your average.
A 2.4× multiplier means publishing at 7pm Tuesday gets you 2.4× the engagement of the same post at your worst time. That's the difference between a post that builds momentum and one that gets buried.
- Calculated separately per connected platform
- Updates as your audience behaviour shifts over time
- NEXUS uses this window as the default scheduling recommendation
Six health statuses. Always know which platforms need attention.
The summary row at the top of Platform Intelligence tells you instantly where to focus energy — without reading charts.
Platform Health Signals — early warning for every platform.
Know when a platform is silently limiting who sees your content, when your reach is dropping, or when your audience is starting to disengage — before it costs you revenue.
Suppression Risk Score
Low · Medium · HighA warning score built from reach and engagement signals relative to your usual baseline. Shown as low · medium · high risk so you can investigate before a platform quietly throttles distribution.
Reach & distribution signals
Platform-dependentWhen a connected platform exposes reach or impression data, we reflect it alongside health warnings. Not every network reports the same fields — the Master Data Table and Suppression Risk cards are the best place to spot a visibility issue early.
Engagement Health
Trending Up · Stable · DecliningA per-platform engagement health readout that compares recent activity to your baseline. The app surfaces simple trend labels (for example Trending Up · Stable · Declining) so you can act before charts turn red.
Follower Trend Direction
Growth velocityFollower momentum summarised as a direction (for example growing, flat, or declining) from recent history — a quick gut-check before you dive into raw numbers on each platform.
Content Performance by Type — know which format makes you money.
Video vs. Photo vs. Bundle vs. Paid posts. Filter by 7, 30, or 90 days. See which format is actually making you money — not just which gets the most views.
Four content types tracked automatically.
CreatorSense automatically sorts your content into four types — Video, Photo, Bundle, and Paid posts — then shows you total views, average engagement, and total revenue per type. So you can see at a glance which format is worth your time.
- Engagement by type — which format resonates most with your audience
- Revenue by type — which format earns more money per post
- Post count by type — see if you're over-investing in low-return formats
- Filterable — 7 / 30 / 90 day windows for trend analysis
If your paid posts earn 3× more per post than regular photos but you're only publishing one a month, Platform Intelligence flags that. ARIA can then suggest a publishing plan to shift your mix towards what actually earns.
Connect a platform. Get intelligence immediately.
Connect your platforms
Sign in to each platform through your CreatorSense account. Data aggregation starts automatically — no manual setup required.
Platform Intelligence populates
RPM, Brand Rate, Audience Value, Audience Health, Viral Potential, and Peak Performance Window are calculated from your first sync. No setup required.
Click any platform for the full detail panel
Monetization Intelligence · Performance Analytics · Peak Performance Window — all in one expandable detail view per platform.
Scores update automatically
Audience Health, your earnings per 1,000 views, and your Brand Rate all recalculate on every data sync. Your numbers stay current as you grow.
Stop guessing what your platforms are worth. Start knowing.
Platform Intelligence is included on Standard and Professional plans.